Skip to content
teachingjunction.com
  • Blog
  • Home
  • excel 2013

    1. Home>
    2. Blog>
    3. excel 2013
    Read more about the article How to Create Multiple Line Graph In Excel

    How to Create Multiple Line Graph In Excel

    • Post author:Dr. Tahir Mehmood
    • Post published:January 30, 2025
    • Post category:Excel Graphs/Uncategorized

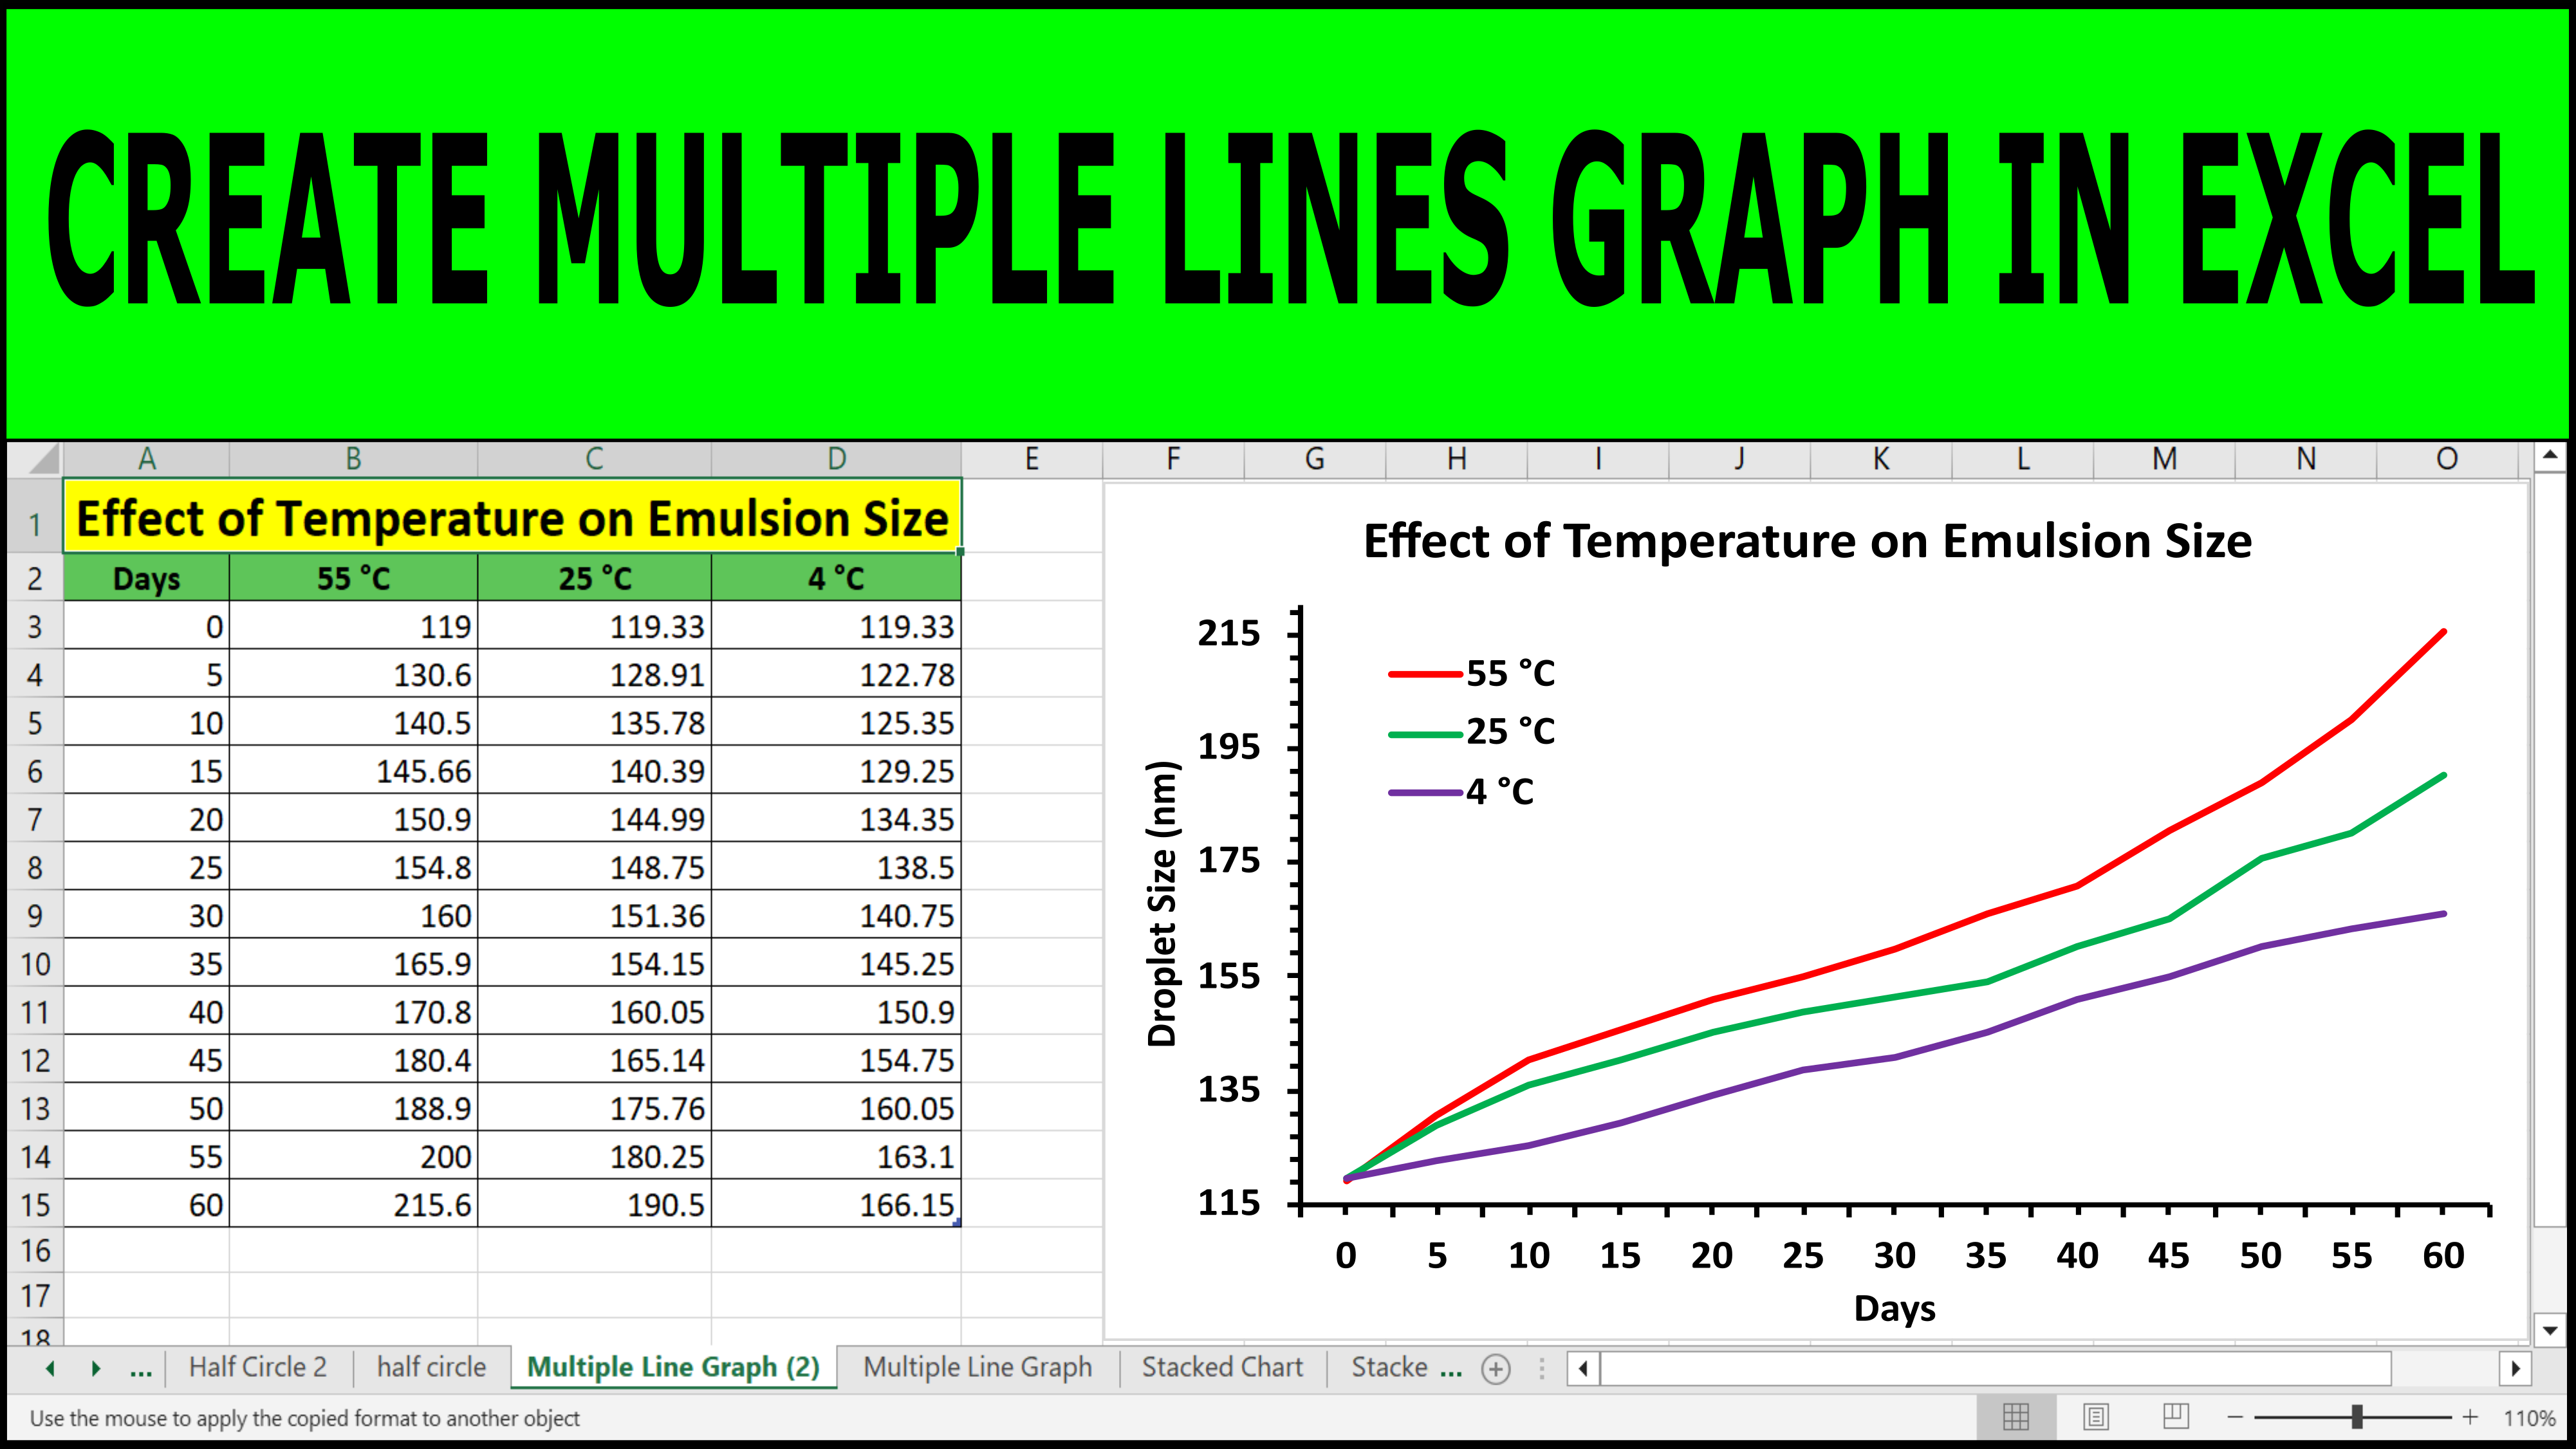
    In this video, you will learn How To Create A Line Graph In Excel using Multiple Data Sets ( Multiple Lines Graph). https://youtu.be/Rz2Rx0GdUsk

    Continue ReadingHow to Create Multiple Line Graph In Excel
    Read more about the article How to Add Error Bars of Standard Deviation in Excel

    How to Add Error Bars of Standard Deviation in Excel

    • Post author:Dr. Tahir Mehmood
    • Post published:August 10, 2024
    • Post category:Excel Graphs

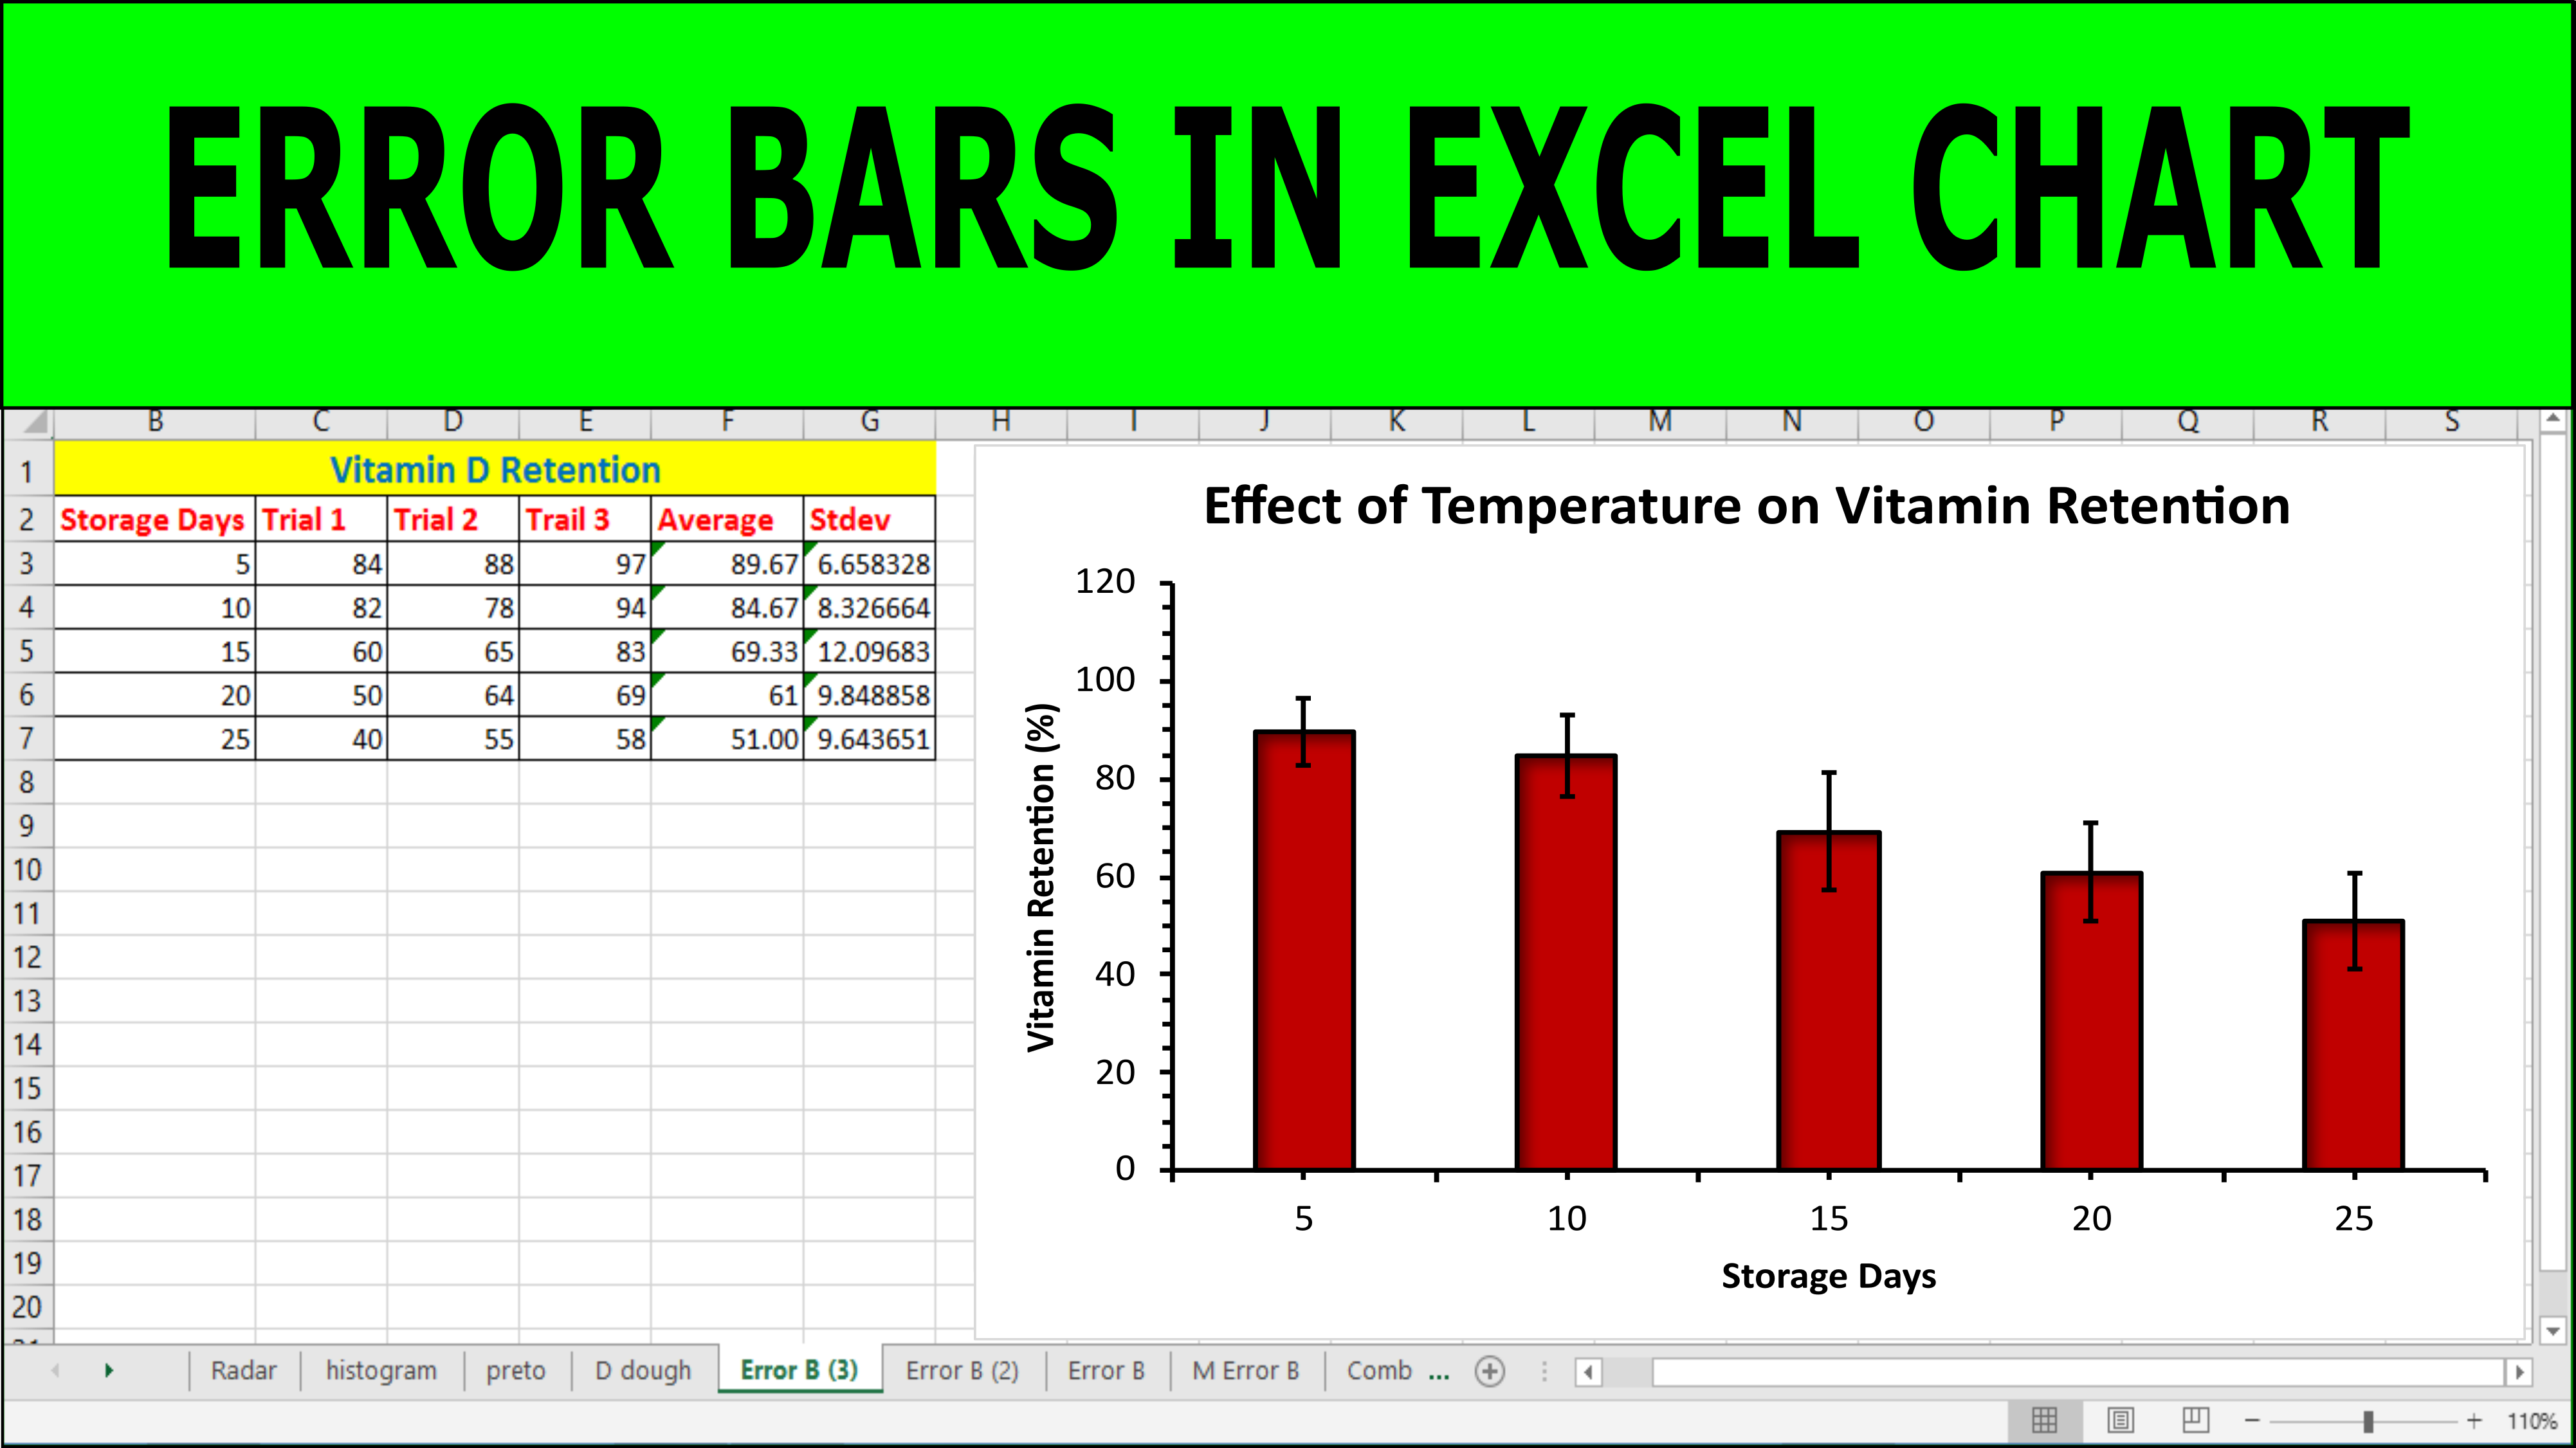
    To add error bars on the basis of standard deviation follow the steps as explained in this video https://youtu.be/7Jv_3woHPvU

    Continue ReadingHow to Add Error Bars of Standard Deviation in Excel

    Recent Posts

    • How to Create Multiple Line Graph In Excel
    • Plot Multiple Lines in Excel
    • How to Create a Pie of Pie Chart in Excel
    • How to Create a Bar of Pie Chart in Excel
    • How to Add Error Bars of Standard Deviation in Excel
    No comments to show.
    Copyright - WordPress Theme by OceanWP