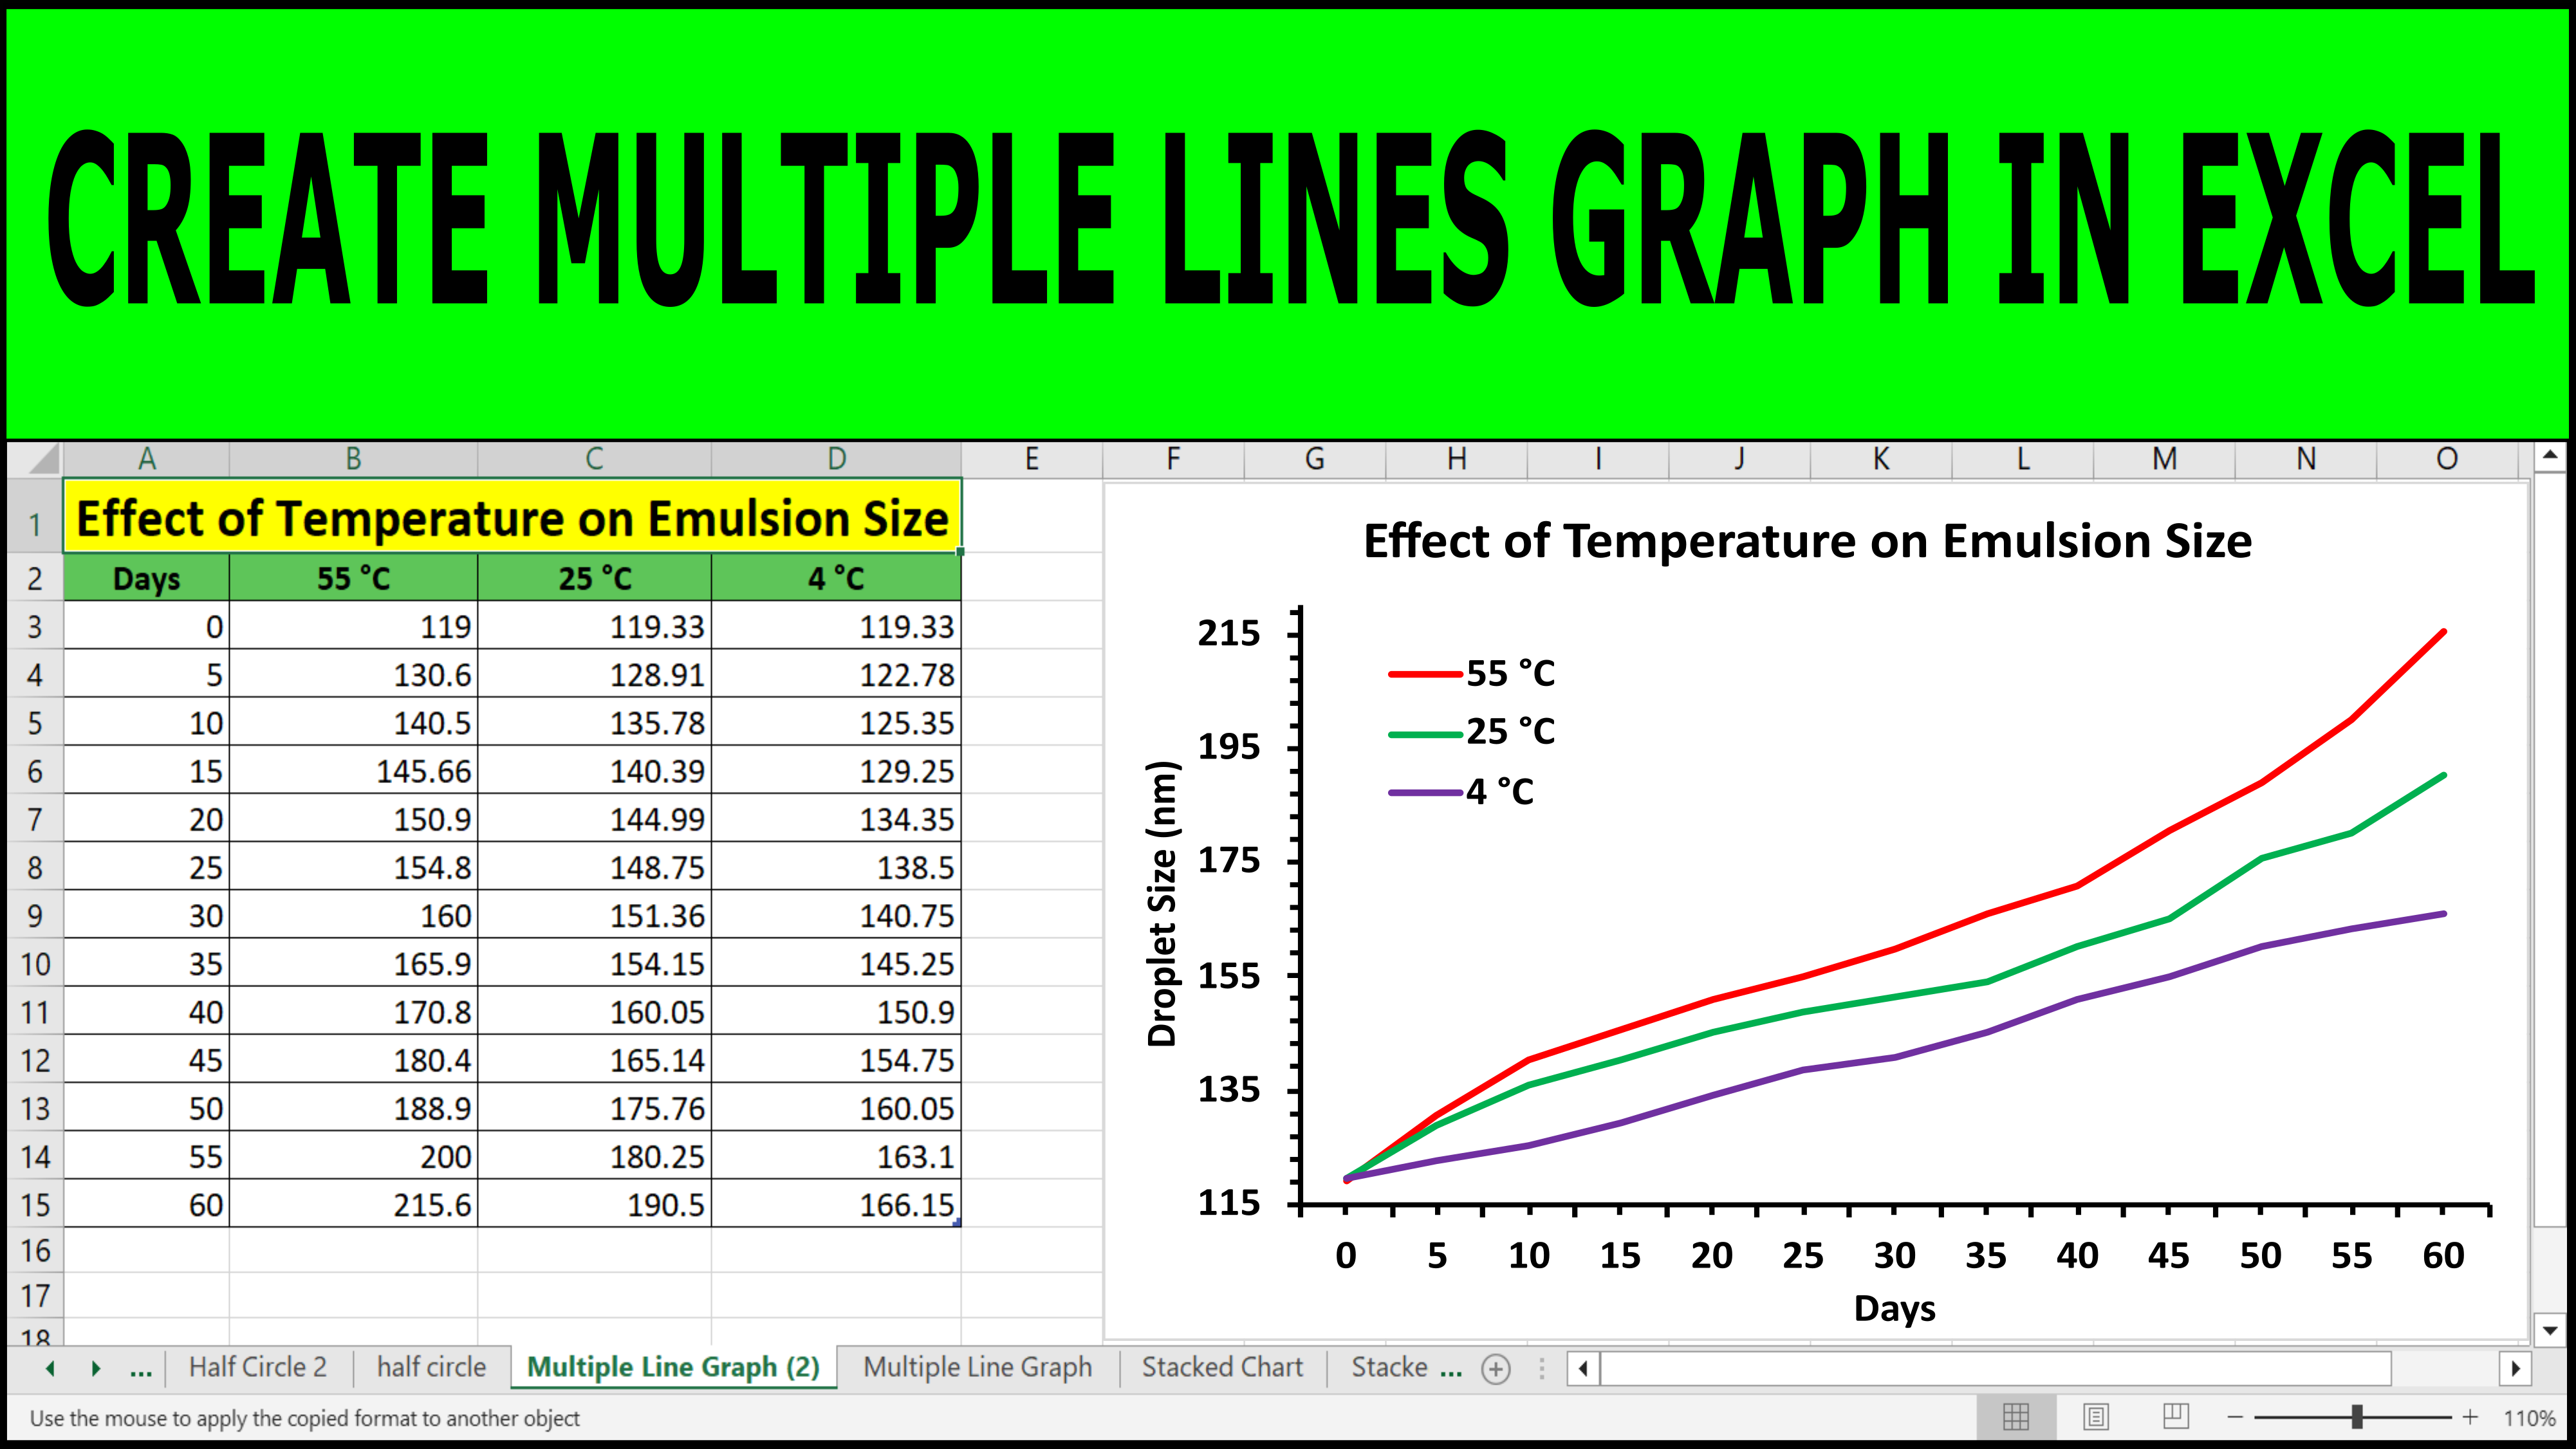
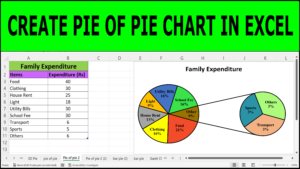
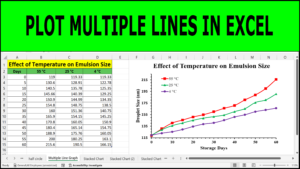
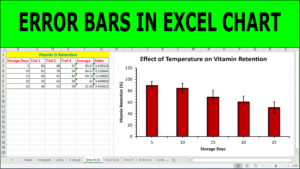
How to Create Multiple Line Graph In Excel Post author:Dr. Tahir Mehmood Post published:January 30, 2025 Post category:Excel Graphs / Uncategorized In this video, you will learn How To Create A Line Graph In Excel using Multiple Data Sets ( Multiple Lines Graph). Tags: excel, excel 2013, excel 2016, excel line graph, how to create a line graph in excel, how to create line graph in excel, how to create line graph in excel with multiple lines, how to make a line graph in excel, how to make line graph in excel, line graph excel, line graph in excel, line graph in excel with multiple lines, making a line graph, making a line graph in, making a line graph in excel with multiple lines, teaching junction, two Read more articles Previous PostPlot Multiple Lines in Excel You Might Also Like How to Create a Pie of Pie Chart in Excel January 30, 2025 Plot Multiple Lines in Excel January 30, 2025 How to Add Error Bars of Standard Deviation in Excel August 10, 2024