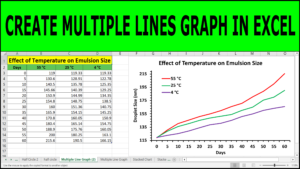
Plot Multiple Lines in Excel Post author:Dr. Tahir Mehmood Post published:January 30, 2025 Post category:Excel Graphs / Uncategorized In this video, you will learn how to create a line graph in Excel. Tags: excel line graph, how to create a line graph in excel, How To Create A Line Graph In Excel (With Multiple Lines), how to create line graph in excel, how to draw line graph in excel, How to graph Multiple lines in 1 Excel plot, how to make a line graph in excel, how to make a line graph on excel, how to make line graph in excel, how to plot line graph in excel, line graph excel, line graph in excel, multiple line graph, Plot Multiple Lines in Excel, teaching junction Read more articles Previous PostHow to Create a Pie of Pie Chart in Excel Next PostHow to Create Multiple Line Graph In Excel You Might Also Like How to Create Multiple Line Graph In Excel January 30, 2025 How to Create a Perceptual Map in Excel August 10, 2024 How to Add Error Bars of Standard Deviation in Excel August 10, 2024