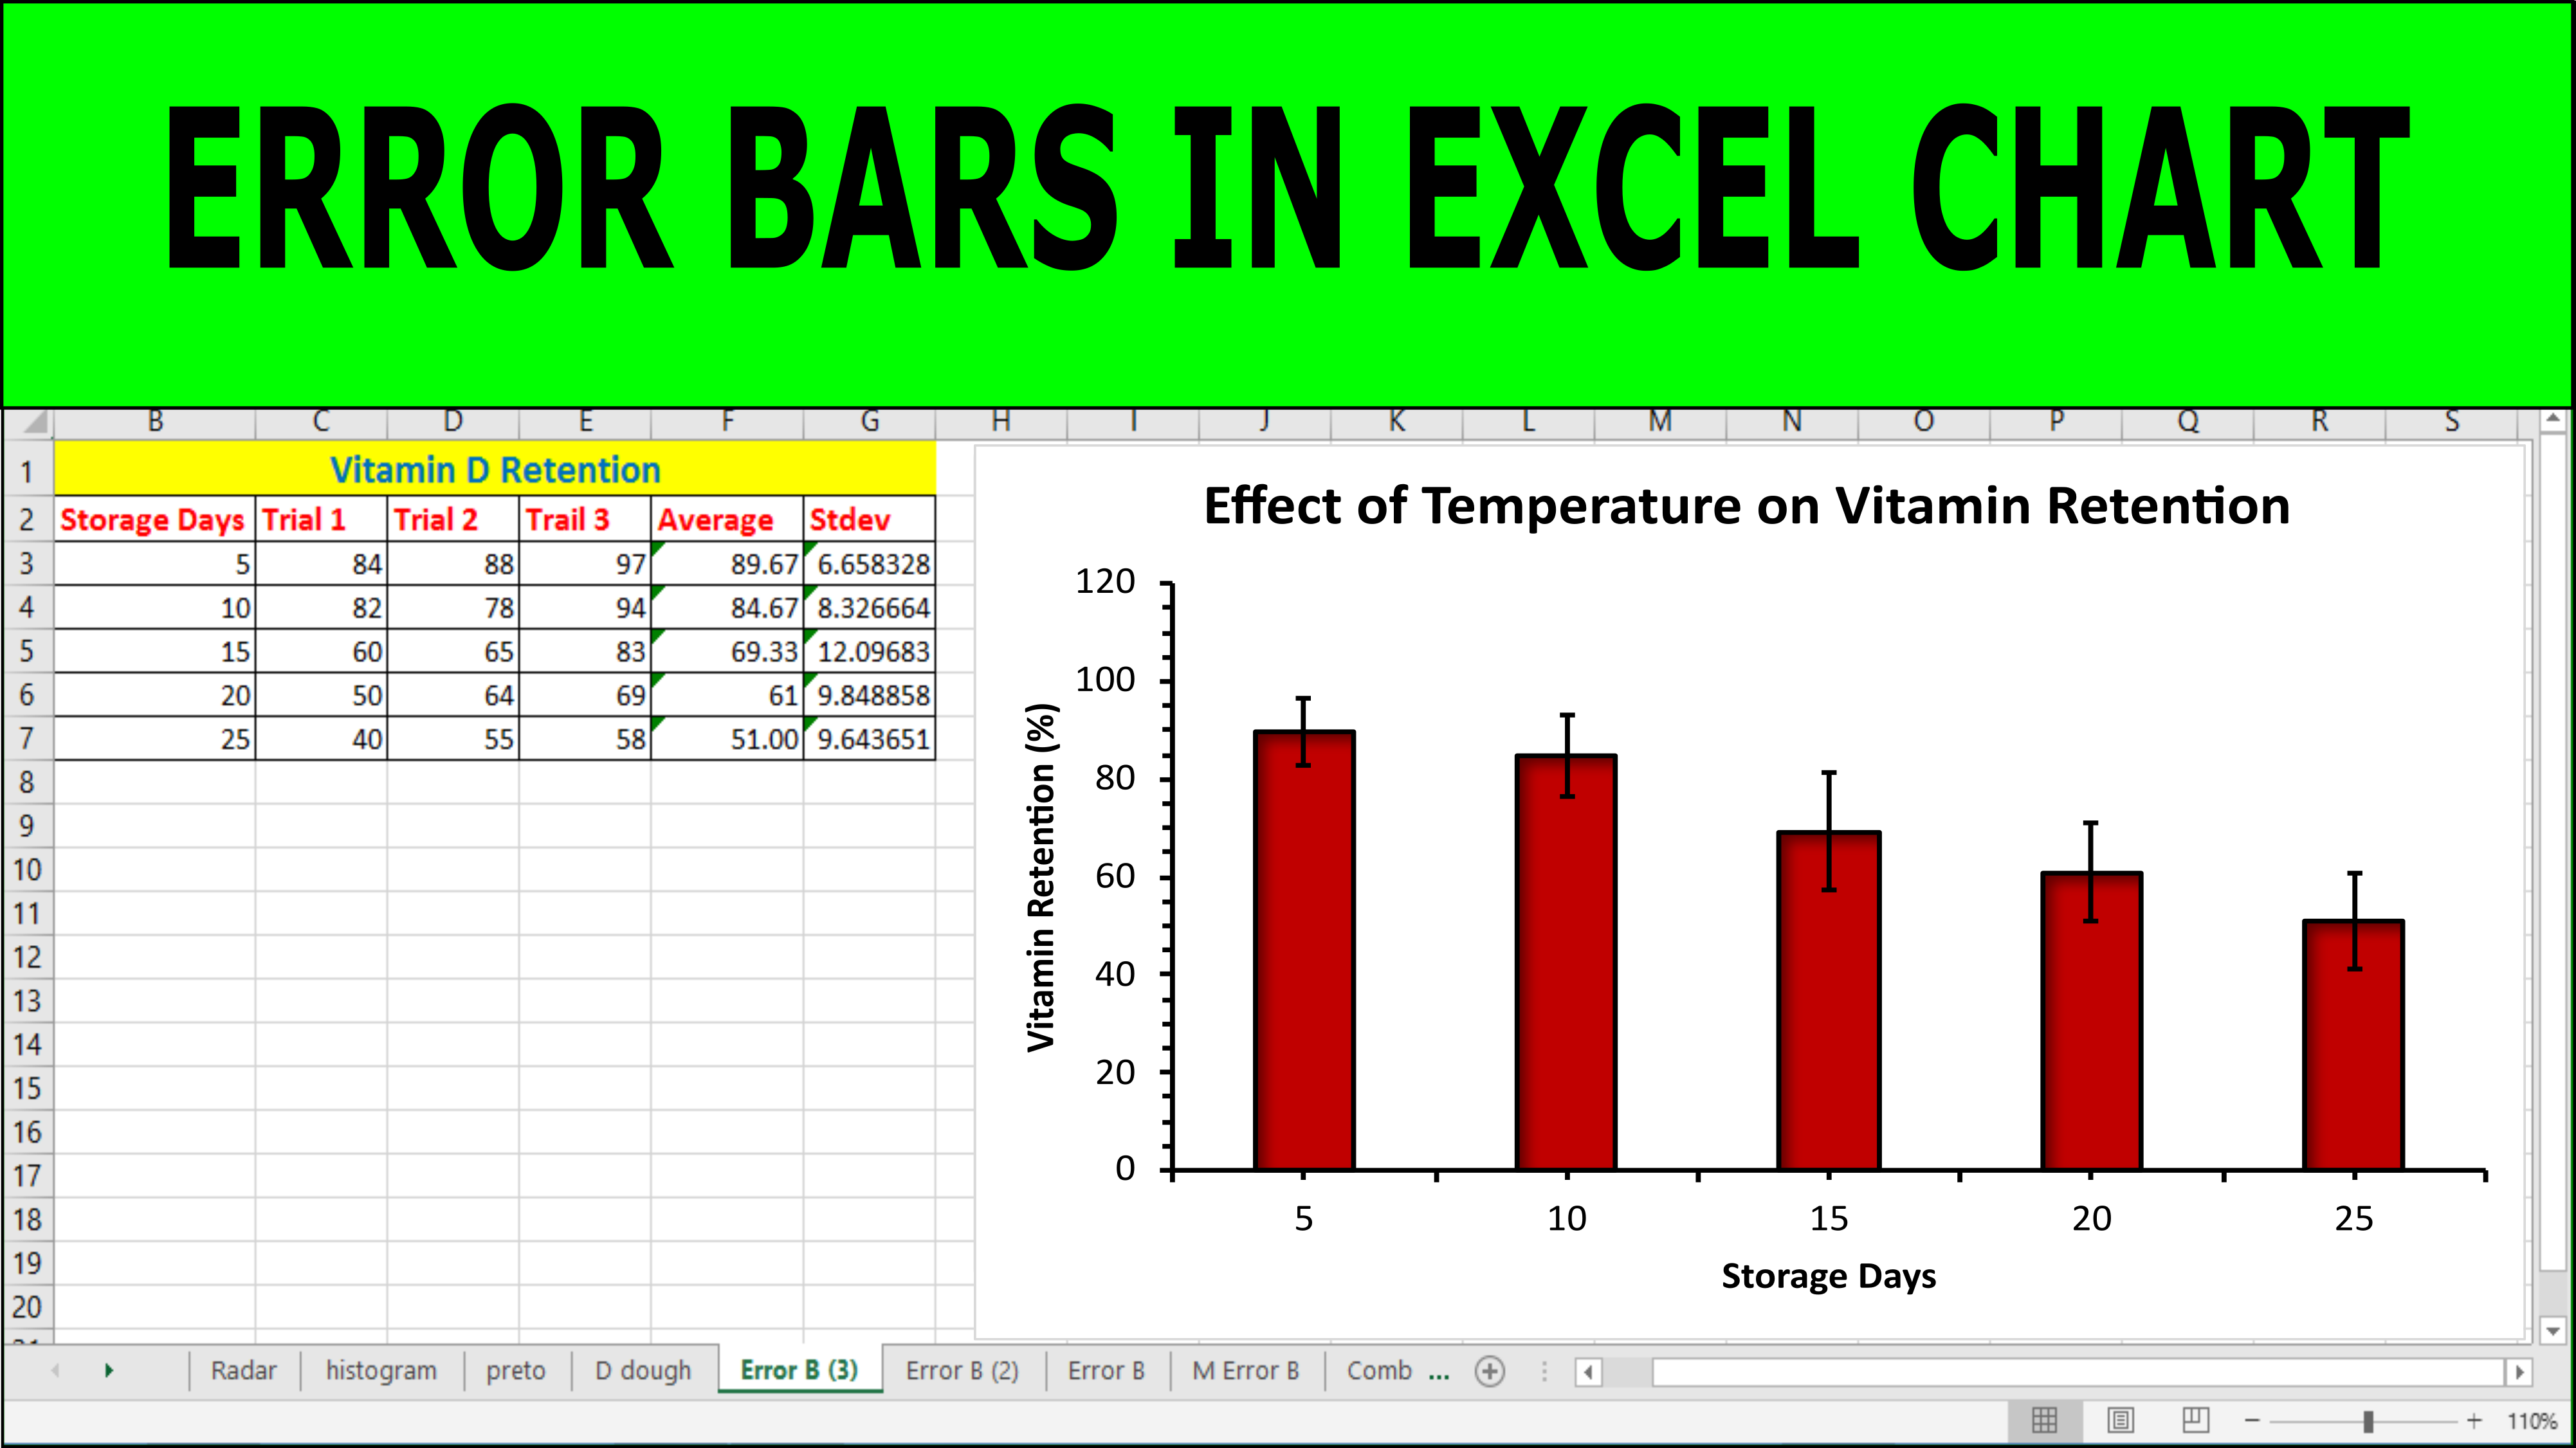
How to Add Error Bars of Standard Deviation in Excel Post author:Dr. Tahir Mehmood Post published:August 10, 2024 Post category:Excel Graphs To add error bars on the basis of standard deviation follow the steps as explained in this video Tags: add error bars, Add Error Bars to a Line Chart, Adding standard error bars to a column graph in Microsoft Excel, bar chart, chart, column chart, create error bars in excel, customize error bars in excel, error bar, error bars, error bars in excel, error bars of standard deviation, excel, excel 2013, excel 2016, how to, how to add error bars in excel, how to add error bars in excel line graph, how to create standard error bars in excel, line chart, microsoft Read more articles Previous PostHow to Create a Perceptual Map in Excel Next PostHow to Create a Bar of Pie Chart in Excel You Might Also Like How to Create a Bar of Pie Chart in Excel January 30, 2025 Plot Multiple Lines in Excel January 30, 2025 How to Create Multiple Line Graph In Excel January 30, 2025